
A Complex Business Process with Interleaved Labor Resources
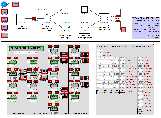 The business simulation model shown at the right was created to
obtain information about the possible reorganization of three
separate work teams and processes into one process under one
administrative group. The impetus for the investigation was
ostensibly that there was company confusion over which team was the
"go to" team for particular jobs. The investigation
directive came from upper management. Significant information
was available for one of the three existing processes -- resource
availability; incoming job types, arrival rates, durations, work
breakdown structures and workflow; and process phase delineation.
For the other two existing processes, similar information was
gathered from interviews and reviews of time sheets. The new
process design represented here basically reflects an organizational
change (though we were prohibited from going outside the existing
teams labor pool). Some technology change was used (an
expansion of the wokflow process to cover all jobs), and there were
some resource reassignments (e.g. the expansion of some existing job
roles to include new responsibilities). The redesign was
careful to follow accepted process design principles, including the
organization of work around outcomes and designing for the dominant
work flow. With these changes, the new process design was
deemed by upper management to be an effective move away from company
confusion. The proposed redesign was reviewed by selected
customers for suggestions and approval.
The business simulation model shown at the right was created to
obtain information about the possible reorganization of three
separate work teams and processes into one process under one
administrative group. The impetus for the investigation was
ostensibly that there was company confusion over which team was the
"go to" team for particular jobs. The investigation
directive came from upper management. Significant information
was available for one of the three existing processes -- resource
availability; incoming job types, arrival rates, durations, work
breakdown structures and workflow; and process phase delineation.
For the other two existing processes, similar information was
gathered from interviews and reviews of time sheets. The new
process design represented here basically reflects an organizational
change (though we were prohibited from going outside the existing
teams labor pool). Some technology change was used (an
expansion of the wokflow process to cover all jobs), and there were
some resource reassignments (e.g. the expansion of some existing job
roles to include new responsibilities). The redesign was
careful to follow accepted process design principles, including the
organization of work around outcomes and designing for the dominant
work flow. With these changes, the new process design was
deemed by upper management to be an effective move away from company
confusion. The proposed redesign was reviewed by selected
customers for suggestions and approval.There are various types of model simulations (see for example reference 1). How "good" a model is depends on how close the model results are to the "real world" events that it's trying to capture (see for example reference 2). Closeness is controlled with what's called model verification and model validation. Simulation model verification ensures that the model is solved and analyzed correctly (by using a modular modeling approach and bottom-up testing, and by using proven solution techniques), while simulation model validation ensures that the real-world process is being accurately represented by the model (by comparing model results with real-world events and by involving real-world event experts). Again, see reference 1 for further expansion. For this simulation, a well known and trusted simulation modeling and analysis package was selected to facilitate verification. Unit testing during the model building period also facilitated verification. Validation centered on the extensive use of real-world input data, on frequent real-world / model output data comparisons and on the use of real-world process experts.
 The figure at right shows sample model output, the result of several
random input runs. Confidence intervals are an important part
of the numerical results, but they are not shown on this summary
image. Since the purpose of the model was to validate or
invalidate the labor resource utilization for a proposed work
breakdown structure and workflow, the changeable maximum number of
resources available for each of the nineteen different resource roles
was moved to the model top level presentation. These individual
resource levels could then be easily changed, the model reanalyzed,
and the new results observed. For example, with the integer
resource levels shown, Advertising (~72% utilization) and WebContent
(~60% utilization) resources are predicted to be overextended, and
MultiMedia (~56% utilization) and Scheduler (~45% utilization)
resources are predicted to be operating close to full capacity.
(As shown in the top-most figure on this page, 45% of
individual time is assumed to be utilized by
"non-job-related" events. Any job-related +
non-job-related percentage approaching or above 90% is assumed to be
a candidate for change.) In addition, there are predicted to be
(over a one year period) approximately five jobs waiting for either
an Advertising or WebContent resource, more than two jobs waiting for
a MultiMedia resource, and around seven jobs waiting for a Scheduler
resource. The model additionally predicts (for example, based
on the data input) that the WebContent resource will complete ~103
"walk-in" jobs in one year, each job taking ~11 work days
for completion and ~0.7 days of actual WebContent resource time (~0.3
days for the work, ~0.3 days for various job-related meetings and
~0.1 days for documentation). The large difference between job span
time and actual work time is a reflection of the resource
unavailability (not just WebContent but also other resources involved
in the particular jobs) and the large number of content walk-in jobs
waiting in the queue.
The figure at right shows sample model output, the result of several
random input runs. Confidence intervals are an important part
of the numerical results, but they are not shown on this summary
image. Since the purpose of the model was to validate or
invalidate the labor resource utilization for a proposed work
breakdown structure and workflow, the changeable maximum number of
resources available for each of the nineteen different resource roles
was moved to the model top level presentation. These individual
resource levels could then be easily changed, the model reanalyzed,
and the new results observed. For example, with the integer
resource levels shown, Advertising (~72% utilization) and WebContent
(~60% utilization) resources are predicted to be overextended, and
MultiMedia (~56% utilization) and Scheduler (~45% utilization)
resources are predicted to be operating close to full capacity.
(As shown in the top-most figure on this page, 45% of
individual time is assumed to be utilized by
"non-job-related" events. Any job-related +
non-job-related percentage approaching or above 90% is assumed to be
a candidate for change.) In addition, there are predicted to be
(over a one year period) approximately five jobs waiting for either
an Advertising or WebContent resource, more than two jobs waiting for
a MultiMedia resource, and around seven jobs waiting for a Scheduler
resource. The model additionally predicts (for example, based
on the data input) that the WebContent resource will complete ~103
"walk-in" jobs in one year, each job taking ~11 work days
for completion and ~0.7 days of actual WebContent resource time (~0.3
days for the work, ~0.3 days for various job-related meetings and
~0.1 days for documentation). The large difference between job span
time and actual work time is a reflection of the resource
unavailability (not just WebContent but also other resources involved
in the particular jobs) and the large number of content walk-in jobs
waiting in the queue. References:
(1) Notes on Systems Modeling
(2) Real World / Model / Analysis relationship diagram
Site managed with MyEclipse, a multi-language, multi-platform IDE